Stylus Documentation Home
Stylus (style + status) is a lightweight status page for home infrastructure.
Configure a set of scripts in bash, Python or any other language that test the various parts of your infrastructure, set up HTML/SVG with a diagram of your network, and Stylus will generate you a dynamic stylesheet to give you a visual overview of the current state.
If you'd like to learn more about Stylus, you can read how it works.
Screenshots
These are some examples of what you can do with Stylus:
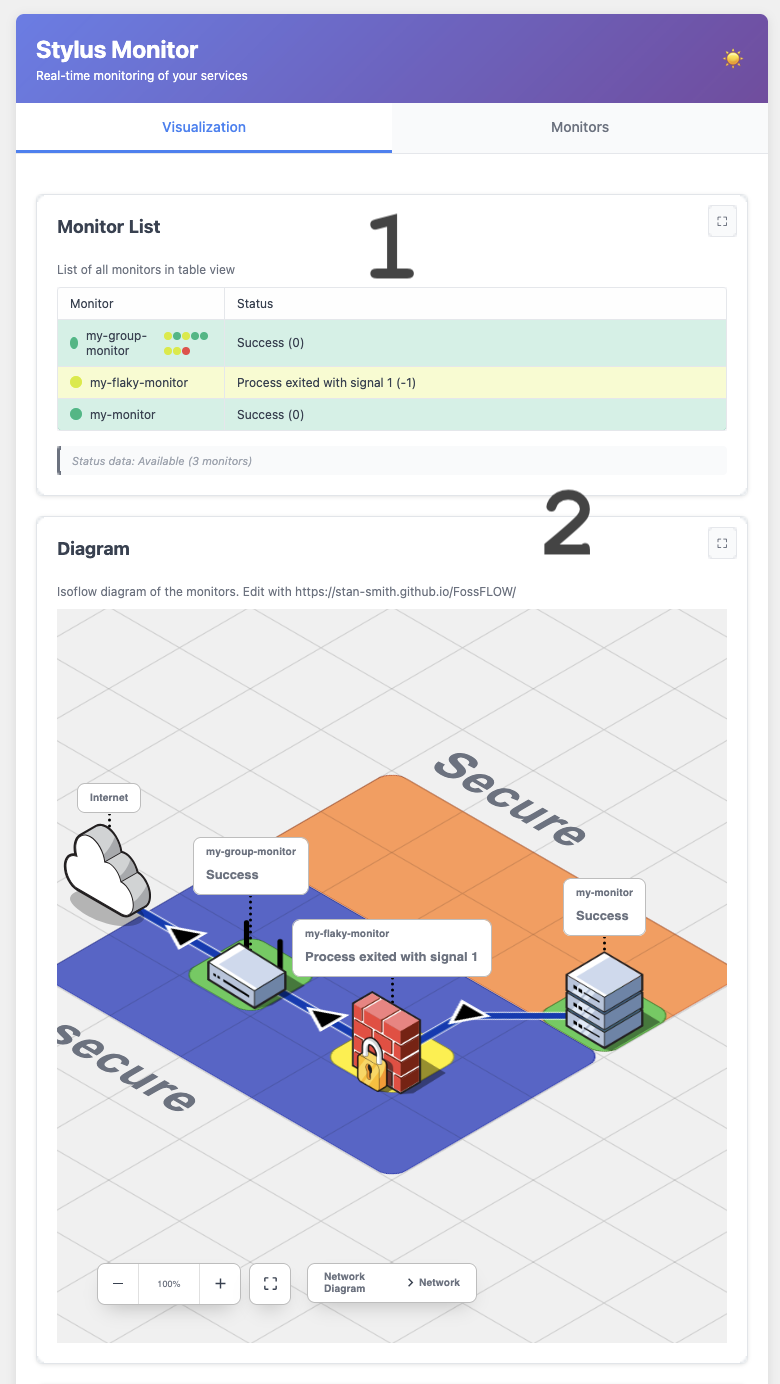
Using the IsoFlow library:
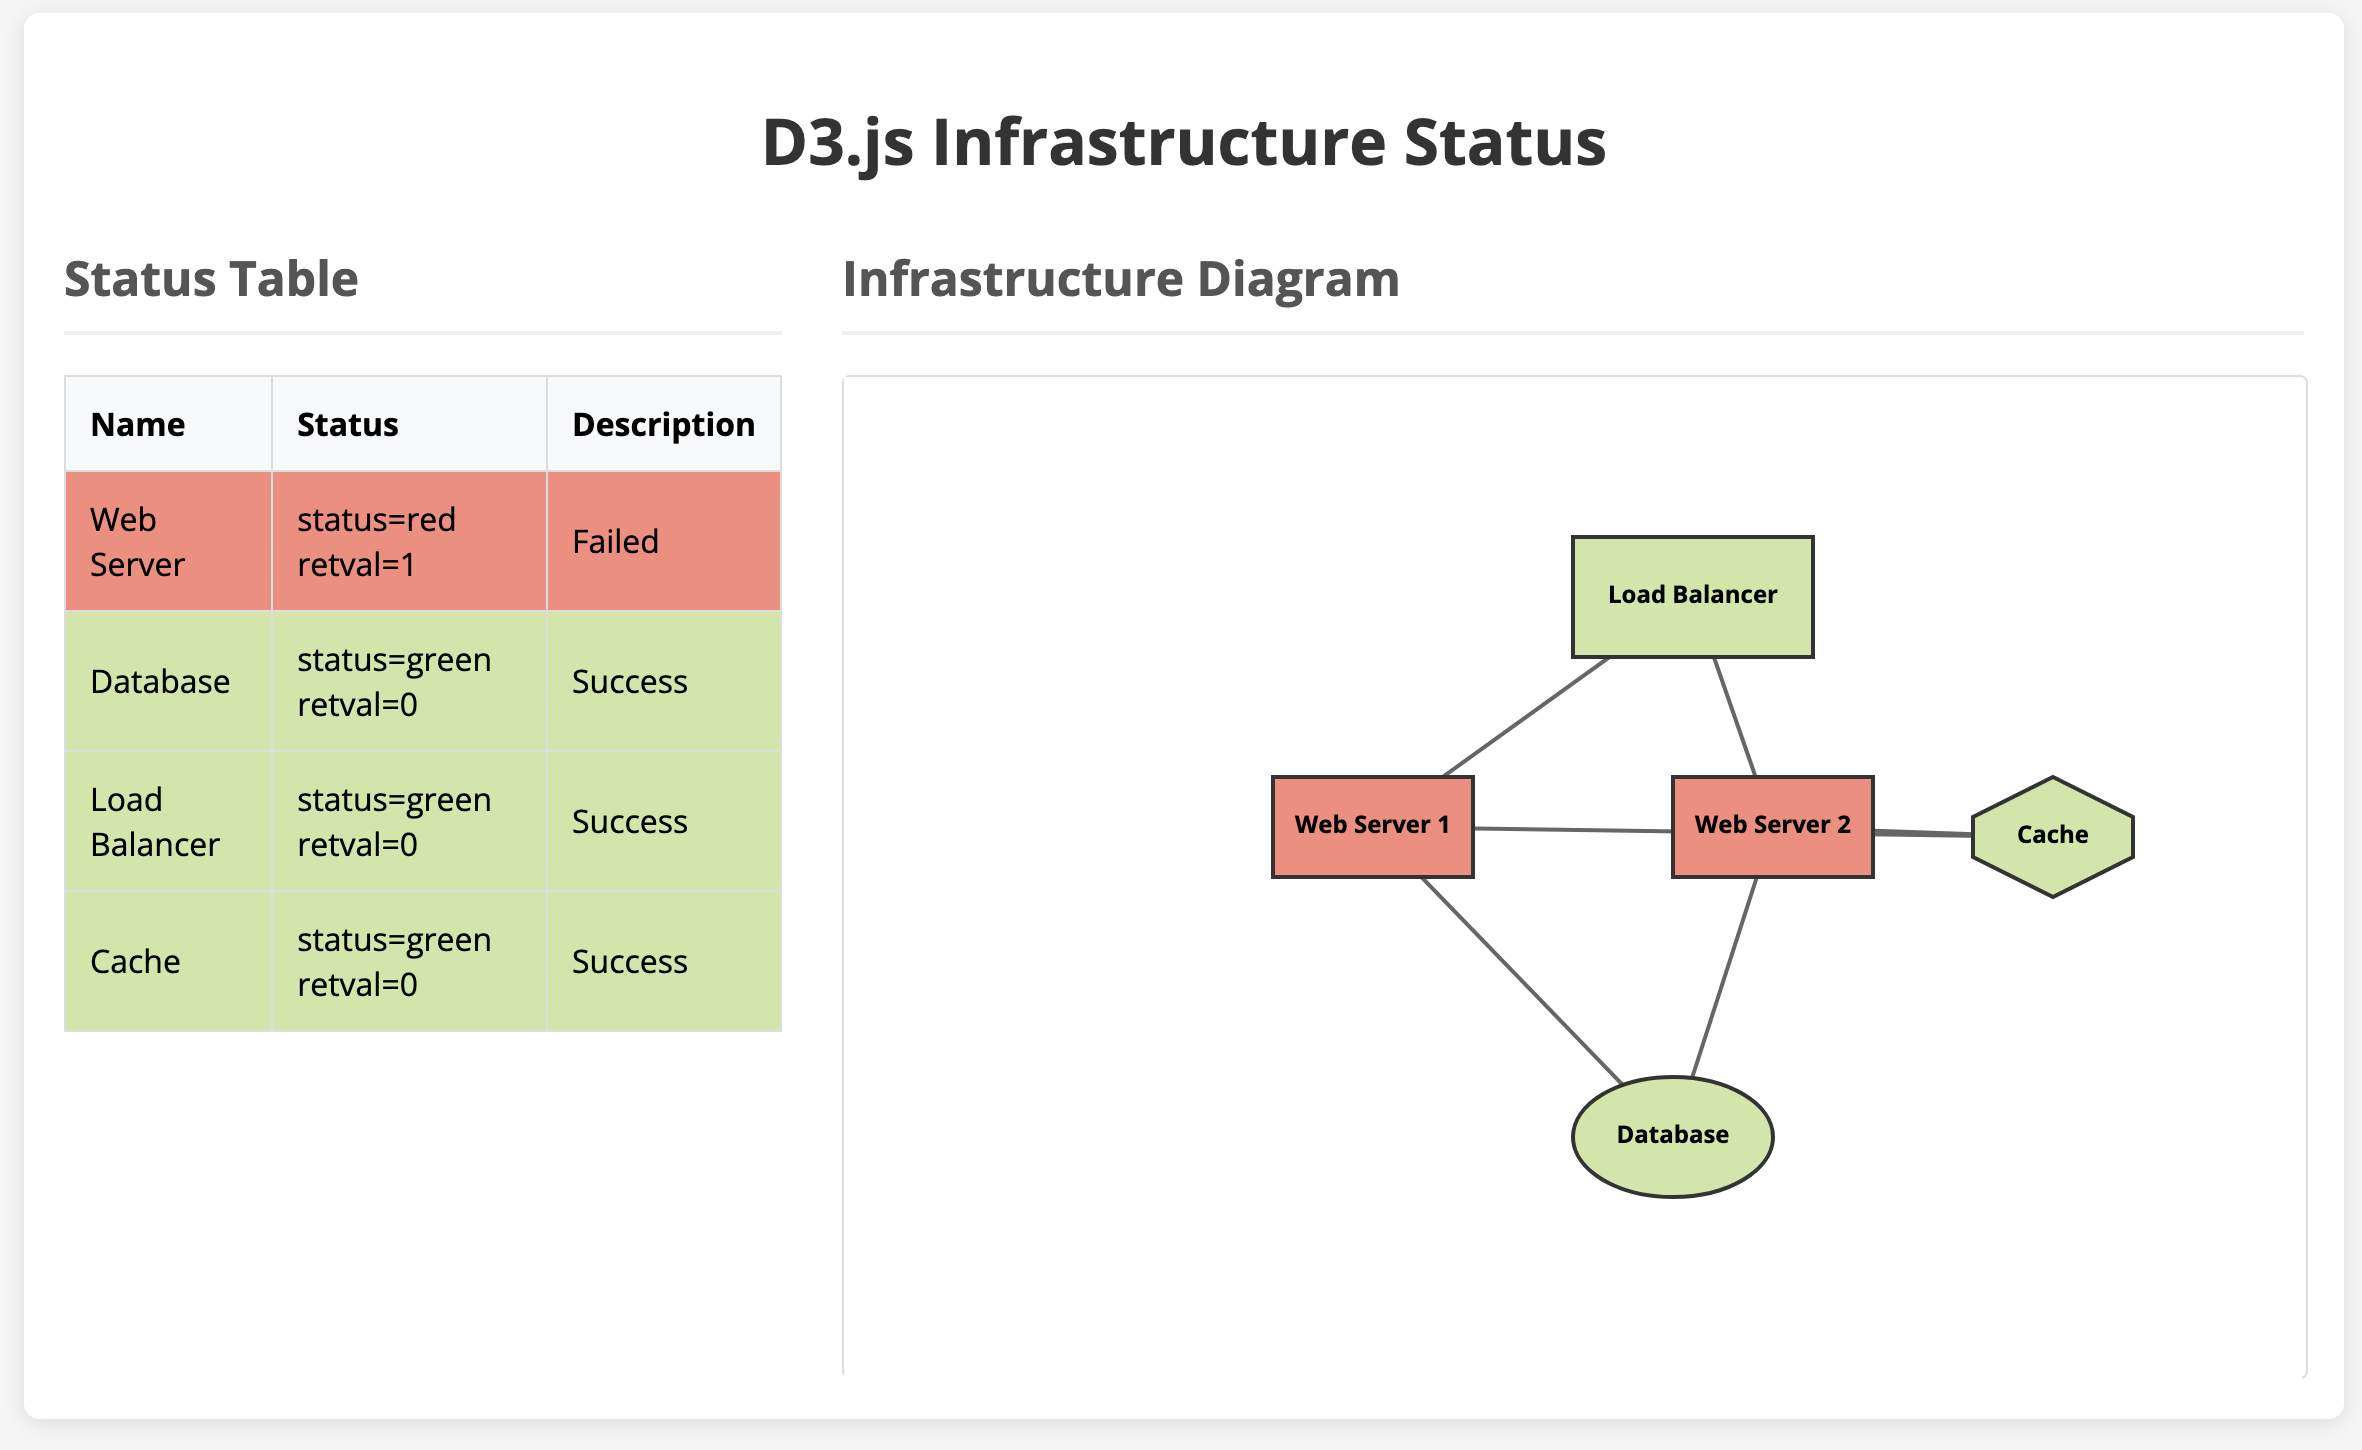
Using the d3.js library:
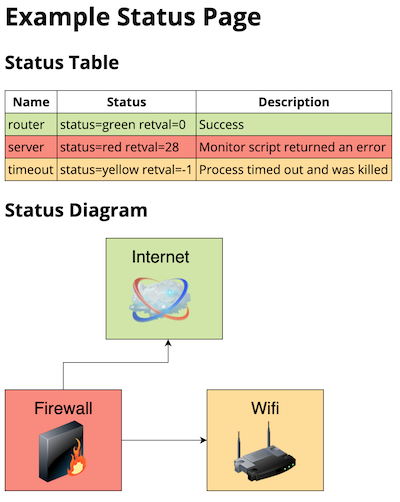
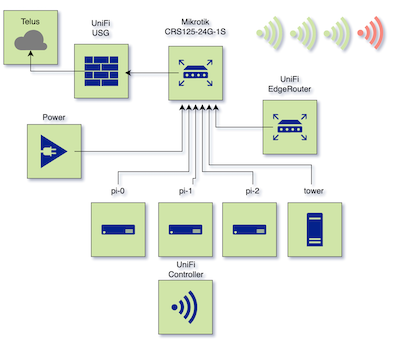
Using an SVG diagram:
Sections
What is Stylus?
Stylus is (1) a service/network monitoring application, and (2) a webserver with special endpoints.
Web Application
Included in the Stylus package is a built-in webapp that includes a number of visualizations, but you can also use it to serve any content you like, even fully replacing the built-in webapp.
The webapp includes an iframe visualization that can be used to display any
URL you like, and if you're serving a local HTML page, can even inject CSS into it
for dynamic updates without scripting.
Status Monitoring
The status monitoring portion is based around scripts, written in any shell
scripting language you like. Each script is run regularly at an interval, and if
the script returns 0 that is considered "up" for a given service. If the
service times out, or returns a non-zero error this is considered a soft
("yellow") or hard ("red") failure.
Web Server
The special endpoints available on the webserver are:
/style.css: A dynamically generated CSS file based on the current/status.json: A JSON representation of the current state
The style.css endpoint may be linked by a HTML or SVG file served from the
static directory that is configured. If desired, the HTML page can dynamically
refresh the CSS periodically using Javascript. See the included
examples
for how this might work.
If you need more flexibility than CSS can provide, you can use the status.json
endpoint to get the current status of the various services, and dynamically
update HTML, SVG images, or potentially even use React.js to update a more
complex and interactive page in real-time.
Stylus ships with a number of examples that can be found in the source bundle.
Copy the simple_network folder to a location of your choice. In this guide we
will assume that it will appear in ~/stylus/.
Once you've got the example set up locally, we can walk though...
- Running Stylus
- Creating a Stylus Project
- Creating Monitors
- Creating Monitor Pages
- Configuration
- Advanced Configuration
Running Stylus
You can run Stylus in several ways:
Docker
The recommended option is to use Docker. A multi-arch Docker container is
available under the repository mmastrac/stylus at
https://hub.docker.com/r/mmastrac/stylus/.
Note that the container is hard-wired to run against a configuration file
located in the container at /srv/config.yaml, and assumes that the remainder
of the configuration is located in subdirectories of /srv.
You should map the container's /srv directory to a local directory containing
your configuration.
# Assume that this is running against the stylus example, this will map the example directory into
# the container's /srv folder. The container will automatically load config.yaml from this folder!
docker run --rm --name stylus -p 8000:8000 -v ~/stylus/:/srv mmastrac/stylus:latest init
docker run --rm --name stylus -p 8000:8000 -v ~/stylus/:/srv mmastrac/stylus:latest
Static Binaries
If you would like to run it from a static binary, you may find a number of pre-built binary releases at https://github.com/mmastrac/stylus/releases.
# This will run against the example in ~/stylus/
stylus_<arch> init ~/stylus/
stylus_<arch> run ~/stylus/
Cargo
For any platform where cargo is natively available, you can simply cargo install the stylus package.
cargo install stylus
stylus init ~/stylus/
stylus run ~/stylus/
From Source
If you have the source downloaded, you can run stylus directly from that source directory.
cargo run -- init ~/stylus/
cargo run -- run ~/stylus/
stylus init
Initialize a new Stylus project directory with default configuration and monitor setup.
Usage
stylus init [OPTIONS] <DIRECTORY>
Arguments
<DIRECTORY>- The directory to initialize
Options
-v, --verbose...- Pass multiple times to increase the level of verbosity (overwritten by STYLUS_LOG)-h, --help- Print help
The stylus init command creates a new Stylus project directory with the following structure:
What Gets Created
<DIRECTORY>/
├── config.yaml          # Main configuration file
├── monitor.d/           # Monitor directory
│   └── monitor/         # Default monitor with id "monitor"
│       ├── config.yaml  # Monitor "monitor" configuration
│       └── test.sh      # Test script for "monitor"
└── static/              # Static files directory
    └── README.md        # Placeholder for static files
Example
# Initialize a new Stylus project in ~/my-stylus
stylus init ~/my-stylus
After initialization, you can start the server with stylus run <DIRECTORY>.
stylus test
Runs the given test immediately and displays the status of the given monitor after it completes.
Usage
stylus test [OPTIONS] --monitor <MONITOR> <FILE>
Arguments
<DIRECTORY>- The configuration directory
Options
-m, --monitor <MONITOR>- The test to run-v, --verbose...- Pass multiple times to increase the level of verbosity (overwritten by STYLUS_LOG)-h, --help- Print help
The stylus test command runs a specific monitor test immediately and shows you the output without starting the full server. This is perfect for debugging monitor scripts or checking if your configuration works.
Example
# Test a monitor named "web-server"
stylus test --monitor web-server ~/my-stylus/

# Test with verbose output
stylus test -v --monitor web-server ~/my-stylus/
The command shows you three things:
- Monitor Log: What your script actually output
- State: How Stylus interpreted the results
- CSS: The CSS rules that would be generated
Monitor Log
-----------

2025-07-09T00:45:40.144844+00:00 [exec  ] Starting
2025-07-09T00:45:40.149592+00:00 [meta  ] status.metadata.rps="RPS: 443"
2025-07-09T00:45:40.149627+00:00 [stdout] Web server is responding normally
2025-07-09T00:45:40.149633+00:00 [stderr] + echo '@@STYLUS@@ status.metadata.rps="RPS: 443"'
2025-07-09T00:45:40.149638+00:00 [stderr] + '[' 5 -lt 8 ']'
2025-07-09T00:45:40.149643+00:00 [stderr] + echo 'Web server is responding normally'
2025-07-09T00:45:40.149646+00:00 [stderr] + exit 0
2025-07-09T00:45:40.149666+00:00 [exec  ] Termination: 0

State
-----

{
  "id": "web-server-1",
  "config": {
    "interval": "3s",
    "timeout": "10s",
    "command": "test.sh"
  },
  "status": {
    "status": "green",
    "code": 0,
    "description": "Success",
    "css": {
      "metadata": {
        "color": "#d0e6a5"
      }
    },
    "metadata": {
      "rps": "RPS: 443"
    },
    "log": [
      "2025-07-09T00:45:40.144844+00:00 [exec  ] Starting",
      "..."
      "2025-07-09T00:45:40.149666+00:00 [exec  ] Termination: 0"
    ]
  },
  "children": {}
}

CSS
---

/* web-server-1 */

/* Default rules */
[data-monitor-id="web-server-1"] {
  --monitor-id: "web-server-1";
  --monitor-status: green;
  --monitor-code: 0;
  --monitor-description: "Success";
  --monitor-metadata-rps: RPS: 443;
}
#web-server-1,
[data-monitor-id="web-server-1"] {
background-color: #d0e6a5 !important;
fill: #d0e6a5 !important;
}

#web-server-1 td:nth-child(2)::after {
content: "status=green retval=0"
}

#web-server-1 td:nth-child(3)::after {
content: "Success"
}
stylus run
Run Stylus (default command)
Usage
stylus run [OPTIONS] [FILE]
Arguments
[FILE]- The configuration file (or directory)
Options
--dry-run- Dry run the configuration (everything except running the server)-v, --verbose...- Pass multiple times to increase the level of verbosity (overwritten by STYLUS_LOG)-h, --help- Print help
The stylus run command starts the Stylus server and begins monitoring your infrastructure. This is the main command you'll use to run Stylus in production.
The command loads your configuration, starts the HTTP server, and begins running your monitor tests on their schedules. It also serves your status page and provides API endpoints for the current monitor states.
Examples
# Run using a directory (will look for config.yaml inside)
stylus run ~/my-stylus/

# Run with verbose output
stylus run -v ~/my-stylus/

# Dry run - test configuration without starting server
stylus run --dry-run ~/my-stylus/
If you specify a directory instead of a file, Stylus will look for config.yaml inside that directory. This is the most common way to run it.
Dry Run Mode
The --dry-run option tests your configuration without starting the server. This is useful for validating configuration syntax locally or in a CI/CD pipeline.
Server Endpoints
Once running, the server provides several endpoints:
/- Main status page/status.json- JSON API with current monitor states/style.css- Dynamic CSS with current monitor states/log/<monitor-id>- Log output for specific monitors
Stopping the Server
Use Ctrl+C to stop the server gracefully. Stylus will clean up any running monitor processes.
Creating a Stylus Project
You can create a new Stylus project by running the stylus init command. This creates a new directory with a default configuration and a monitor.d directory with a single monitor test.
$ stylus init ~/stylus
Initializing directory: "~/stylus"...
Done!

Run `stylus "~/stylus"` to start the server

$ tree ~/stylus/
├── README.md
├── config.d
│   └── isoflow.json
├── config.yaml
├── monitor.d
│   ├── my-flaky-monitor
│   │   ├── config.yaml
│   │   └── test.sh
│   ├── my-group-monitor
│   │   ├── config.yaml
│   │   └── test.sh
│   └── my-monitor
│       ├── config.yaml
│       └── test.sh
└── static
    ├── README.md
    └── iframe.html
Once you've created the project, you can start the server with the stylus run command.
stylus run ~/stylus
If you open your web browser to http://localhost:8000, you should see a
very basic default page with a green status. You'll also find a link to the
status JSON and style CSS endpoints, as well as the per-monitor log output:
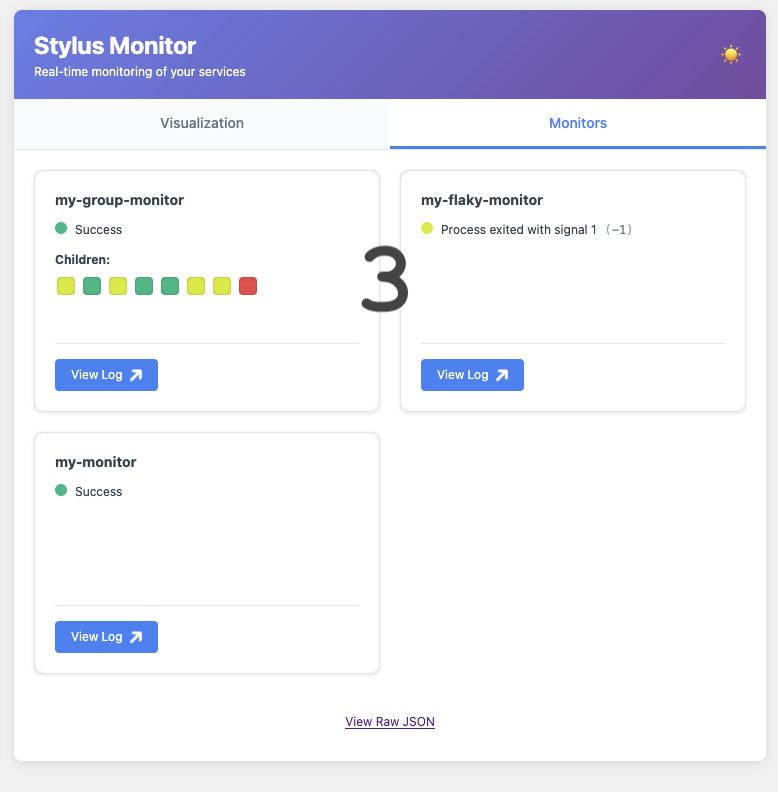
By default, Stylus renders a basic summary page for all of your monitors. This lets you work on your monitors before creating any custom pages. When you open the default project, you'll see three sections:
- A table visualization showing all the monitors
- An Isoflow visualization, updating the diagram when the status changes
- The monitor page listing the raw monitors, and their status, along with a button to view the log output for each
Creating Monitors
A monitor is a script that is run periodically to check the status of a system.
Monitors are defined in the monitor.d directory in a Stylus project.
Monitors consist of a configuration file and a test script.
Using the project we created in the previous section, let's take a look at the monitor that was created for us. The configuration from the initial project is:
$ cat ~/stylus/monitor.d/monitor/config.yaml
test:
  interval: 30s
  timeout: 10s
  command: test.sh

$ cat ~/stylus/monitor.d/monitor/test.sh
#!/bin/sh
echo 'Write your test script here'
The interval and timeout fields are used to control how often the monitor
is run and how long it is allowed to run for. The command field is the path
to the test script.
The test script is a simple shell script that will be run by the monitor.
To help you develop and debug monitors, Stylus provides a stylus test command that runs the test script and shows you exactly what happens.
$ stylus test --monitor monitor ~/stylus/config.yaml
Monitor Log
-----------

<timestamp> [exec  ] Starting
<timestamp> [stdout] Write your test script here
<timestamp> [exec  ] Termination: 0

State
-----

{
  "id": "monitor",
  "config": {
    "interval": "30s",
    "timeout": "10s",
    "command": "test.sh"
  },
  "status": {
    "status": "green",
    "code": 0,
    "description": "Success",
    "css": {
      "metadata": {}
    },
    "metadata": {},
    "log": [
      // ...
    ]
  },
  "children": {}
}

CSS
---

/* monitor */

/* Default rules */
[data-monitor-id="monitor"] {
  --monitor-id: "monitor";
  --monitor-status: green;
  --monitor-code: 0;
  --monitor-description: "Success";
}
Modifying the Monitor
Let's say that we want to change the test script to check if the server can see
the internet. We'll using ping 8.8.8.8 as a proxy test for the internet
existing.
Let's update test.sh to:
#!/bin/sh
ping -c 1 8.8.8.8
Now let's run the test again:
$ stylus test --monitor monitor ~/stylus/config.yaml
Monitor Log
-----------

<timestamp> [exec  ] Starting
<timestamp> [stdout] PING 8.8.8.8 (8.8.8.8): 56 data bytes
<timestamp> [stdout] 64 bytes from 8.8.8.8: icmp_seq=0 ttl=111 time=20.496 ms
<timestamp> [stdout]
<timestamp> [stdout] --- 8.8.8.8 ping statistics ---
<timestamp> [stdout] 1 packets transmitted, 1 packets received, 0.0% packet loss
<timestamp> [stdout] round-trip min/avg/max/stddev = 20.496/20.496/20.496/0.000 ms
<timestamp> [exec  ] Termination: 0

...
As expected, the monitor successfully pings the internet.
More Complex Monitors
Monitors can be as simple or complex as you need them to be. Here are a few examples to get you started.
For example, you can use curl to request a JSON endpoint from a web service,
and ensure that it returns a healthy response:
#!/bin/sh
set -xeuf -o pipefail
# Check the health of a service running on the monitor
STATUS=$(curl --fail http://my-web-server:8080/health | jq --raw-output '.status')
if [ "$STATUS" != "OK" ]; then
  echo "Service unhealthy: $STATUS"
  exit 1
fi
If you want to monitor network devices, you can often use the SNMP protocol.
Stylus has a built-in SNMP monitor that can be used to monitor network devices, but in some cases you may want to write a custom script to monitor SNMP devices for more complex checks.
See the manual for your networking device for the appropriate OIDs to use, or reference one of the following resources:
- https://ldapwiki.com/wiki/Wiki.jsp?page=SNMP
- https://networklessons.com/cisco/ccie-routing-switching/introduction-to-snmp
#!/bin/sh
set -xeuf -o pipefail
# Print the SNMP OID for the system description
snmpwalk -v 2c -c public my-network-router 1.3.6.1.2.1.1.1.0
# Print the SNMP OID for the system uptime
snmpwalk -v 2c -c public my-network-router 1.3.6.1.2.1.1.3.0
For more information on complex monitors, see the examples.
Visualizations
The default Stylus webapp provides a few builtin visualizations to get you up and running quickly.
Overview
Visualizations are configured in your config.yaml file under the ui.visualizations section. Each visualization has a type, title, description, and type-specific configuration options.
Configuration
ui:
  visualizations:
    - title: "Service Status"
      description: "Overview of all monitored services"
      type: "table"
    - title: "Network Diagram"
      description: "Visual representation of network topology"
      type: "svg"
      url: "/network.svg"
    - title: "Infrastructure Dashboard"
      description: "Interactive infrastructure overview"
      type: "iframe"
      url: "/dashboard.html"
      inject: true
Visualization Types
Row Visualization
The row visualization allows you to split a visualization into multiple columns with configurable widths. Each column can contain any other visualization type.
Configuration:
- title: "My Rows"
  description: "Row description"
  type: "row"
  columns:
    - type: "table"
      width: 1
    - type: "stack"
      width: 2
      stacks:
        - title: "Rack 1"
          rows:
            - id: "router"
              size: "small"
              layout: 3x1 4x2
    - type: "svg"
      width: 1
      url: "/network.svg"
The width parameter for each column determines how much of the available space
the column should take up.
Table Visualization
The table visualization displays monitor status in a structured table format with status indicators and clickable rows for log viewing.
Configuration:
- title: "Service Status"
  description: "Overview of all monitored services"
  type: "table"
Stack Visualization
The stack visualization displays monitor status like a rack of servers.
Configuration:
- title: "Rack Status"
  description: "Rack of servers with status indicators"
  type: "stack"
  stacks:
    - title: "Rack 1"
      rows:
        - id: "group"
          size: "small"
          # Two 1x2 groups, two column-wise 2x2 groups (4 + 8 = 12 ports total)
          layout: 2x1x2 ~2x2x2
          # Order the status indicators by index as [6, 1, 2, 3, 4, 5, 10, 9, 8, 7, 20, 21]
          order: 6 1-5 10-7 20-21
The size parameter controls the size of the status indicators.
The layout parameter controls the layout of the status indicators. A single
number indicates a 1-high group (ie: W), two numbers are WxH, three number is
NxWxH, where N repeats the WxH group. A layout group prefixed with ~ indicates
that the group is laid out column-wise rather than row-wise.
The order parameter controls the order of the status indicators. It is a
space-separated list of ranges and single numbers. Ranges are inclusive, and
support reverse order.
Each group is laid out in order from left to right on each row, unless the group
is prefixed with ~, in which case it is laid out top-to-bottom on each column.
Each port is taken from the next item in the order list.
SVG Visualization
The SVG visualization loads an SVG file and applies dynamic styling based on monitor status. This works well with network diagrams, flowcharts, and other vector graphics.
The SVG is loaded from the static/ directory, and is automatically updated
when the status changes.
Configuration:
- title: "Network Diagram"
  description: "Visual representation of network topology"
  type: "svg"
  url: "/network.svg"
The SVG visualization automatically applies your configured CSS rules to the SVG
content. The recommended method is setting data-monitor-id attributes on the SVG
elements, and applying fill: CSS rules.
See the CSS Configuration section for more details.
Iframe Visualization
The iframe visualization embeds external HTML content with optional style injection, allowing you to create custom visualizations that fit into the existing pages. See Custom Monitor Pages for more details.
Configuration:
- title: "Infrastructure Dashboard"
  description: "Interactive infrastructure overview"
  type: "iframe"
  url: "/dashboard.html"
  inject: true
When inject: true is set, the monitor CSS is automatically injected into the
iframe, applying to the content within.
Isoflow Visualization
The Isoflow visualization provides interactive diagrams with dynamic data updates.
Configuration:
- title: "Service Flow"
  description: "Interactive service dependency diagram"
  type: "isoflow"
  config: "service-flow"
Isoflow visualizations require initial data to be placed in
config.d/{config-name}.json. The data is automatically updated with status
information when available.
Fullscreen Mode
All visualizations support fullscreen mode for detailed viewing. Click the
fullscreen button (⛶) in the top-right corner of any visualization card.
Examples
Simple Status Dashboard
A table and SVG diagram.
ui:
  visualizations:
    - title: "Service Status"
      description: "Overview of all monitored services"
      type: "table"
    - title: "Network Topology"
      description: "Network diagram with status colors"
      type: "svg"
      url: "/network.svg"
A table, iframe, and Isoflow diagram.
ui:
  visualizations:
    - title: "Service Status"
      description: "Quick overview of all services"
      type: "table"
    - title: "Infrastructure Diagram"
      description: "D3.js infrastructure visualization"
      type: "iframe"
      url: "/infrastructure.html"
      inject: true
    - title: "Service Dependencies"
      description: "Interactive dependency flow"
      type: "isoflow"
      config: "dependencies"
A row visualization with multiple columns.
ui:
  visualizations:
    - title: "Dashboard"
      description: "Multi-column dashboard layout"
      type: "row"
      columns:
        - type: "table"
          width: 1
        - type: "stack"
          width: 2
          stacks:
            - title: "Rack 1"
              rows:
                - id: "router"
                  size: "small"
                  layout: 3x1 4x2
        - type: "svg"
          width: 1
          url: "/network.svg"
Advanced Usage
Custom Visualization Development
For complex visualizations, you can create custom HTML/JavaScript applications
and embed them using the iframe visualization type. This allows for complex
interactive dashboards, real-time data visualization, and integration with
external monitoring systems.
See the Custom Monitor Pages section for more details.
Creating Custom Monitor Pages
Stylus ships with a built-in webapp that includes a number of visualizations, but you can also use it to serve any content you like, even fully replacing the built-in webapp.
Rendering Technologies
Stylus works particularly well with SVG diagrams, but can use any markup language that supports either CSS or dynamic updates via JSON data (eg: Angular, React, etc).
HTML
React is a popular library for building user interfaces. Using /status.json
as the data source, you can create a simple page with the current state of the
monitors.
The IsoFlow component for React allows you to load a model and render it as an isometric diagram with a little bit of glue in Stylus:

SVG
SVG is a flexible image format that conveniently supports CSS styling. See the SVG tutorial for more details on building a diagram using diagrams.net.
d3.js is a popular library for creating interactive
diagrams. See the d3.js example in the
repository for an
example of how to use it with Stylus.
Hooks and Endpoints
There are number of provided hooks for updating status, and depending on which technology you'd like to use for your status page, you can choose which one makes sense.
Monitors are independent of the the technology you use to render your page, so you can start with a very basic page and then add more complexity as you go.
CSS
The simplest way to create a monitoring page is to use CSS to update the status of the page.
The /style.css route serves live CSS with the current state of the monitors.
For each monitor, Stylus will generate a CSS block with the current state of the monitor as CSS variables (including any metadata your script has generated):
[data-monitor-id="web-server-1"] {
  --monitor-id: "web-server-1";
  --monitor-status: green;
  --monitor-code: 0;
  --monitor-description: "Success";
  --monitor-metadata-rps: RPS: 702;
}
These CSS variables can be used for basic styling of the page, but it is highly recommended to generate more complex CSS rules to style the page.
In your project's config.yaml file, you can specify a number of rules to
style the page. For each rules in this section, a CSS block will be generated
for each monitor.
For example, adding these rules:
  # Specify a number of rules - selector/declaration pairs. Each pair will generate a CSS block.
  rules:
    # Style the HTML/SVG with the appropriate status color
    - selectors: |
        #{{monitor.id}},
        [data-monitor-id="{{monitor.id}}"] > *
      declarations: |
        background-color: {{monitor.status.css.metadata.color}} !important;
        fill: {{monitor.status.css.metadata.color}} !important;
... will generate the following CSS block for each monitor:
/* web-server-1 */

/* Default rules */
[data-monitor-id="web-server-1"] {
  --monitor-id: "web-server-1";
  --monitor-status: green;
  --monitor-code: 0;
  --monitor-description: "Success";
  --monitor-metadata-rps: RPS: 702;
}
#web-server-1, [data-monitor-id="web-server-1"] {
    background-color: #d0e6a5 !important;
    fill: #d0e6a5 !important;
}
See the CSS Configuration section for more details.
JSON
The /status.json route serves the current state of the monitors as JSON.
This can be used for dynamic rendering of the page, or for updating the page with a script.
Each monitor's latest status is available in the JSON response, along with its log output, and any metadata generated by the monitor script.
{
    "id": "database",
    "config": {
        "interval": "5s",
        "timeout": "15s",
        "command": "..."
    },
    "status": {
        "status": "green",
        "code": 0,
        "description": "Success",
        "css": {
            "metadata": {
                "color": "#d0e6a5"
            }
        },
        "metadata": {},
        "log": [
            "2025-07-08T23:51:05.732946+00:00 [exec  ] Starting",
            "..."
        ]
    },
    "children": {}
}
The /config.json route serves the global configuration for the project.
{
    "version": 1,
    "server": {
        "port": 8000,
        "listen_addr": "0.0.0.0"
    },
    "monitor": {
        "dir": "monitor.d"
    }
}
Server Configuration
The server configuration is stored in config.yaml in the root directory of the configuration. This controls the overall server behaviour (including listening ports) and tells Stylus where to find your monitors (monitor.d by default).
# Stylus will fail to load any configuration without a version of 1 (for future extensibility)
version: 1

# HTTP server configuration
server:
  # Listen port (default: 80, but init command uses 8000 for development)
  port: 8000
  # Static file directory
  static: static

# Monitor configuration
monitor:
  # The top-level directory that Stylus looks for monitor directories
  dir: monitor.d

css:
  # Arbitrary metadata can be associated with each of the six states: blank (no state),
  # red (failed), yellow (timed out), green (success), blue (highlight), or orange (warning).

  # Use metadata to get prettier colors - note that we can add arbitrary string keys and values here
  metadata:
    blank:
      color: "white"
    red:
      color: "#fa897b"
    yellow:
      color: "#ffdd94"
    green:
      color: "#d0e6a5"
    blue:
      color: "#3b82f6"
    orange:
      color: "#f9b356"

  # Specify a number of rules - selector/declaration pairs. Each pair will generate a CSS block.
  rules:
    # Style the HTML/SVG with the appropriate status color
    - selectors: "
        #{{monitor.id}},
        [data-monitor-id=\"{{monitor.id}}\"] > *
      "
      declarations: "
        background-color: {{monitor.status.css.metadata.color}} !important;
        fill: {{monitor.status.css.metadata.color}} !important;
      "
    # Add some text for the status/return value of the script
    - selectors: "
        #{{monitor.id}} td:nth-child(2)::after
      "
      declarations: "
        content: \"status={{monitor.status.status}} retval={{monitor.status.code}}\"
      "
CSS Configuration
The CSS configuration controls how Stylus generates dynamic stylesheets based on monitor status. This includes metadata for different states and CSS rules for styling your HTML/SVG elements.
# config.yaml
# version: 1
# server: ...
# monitor: ...

css:
  # Arbitrary metadata can be associated with each of the six states: blank (no state),
  # red (failed), yellow (timed out), green (success), blue (highlight), or orange (warning).

  # Use metadata to get prettier colors - note that we can add arbitrary string keys and values here
  metadata:
    blank:
      color: "white"
    red:
      color: "#fa897b"
    yellow:
      color: "#ffdd94"
    green:
      color: "#d0e6a5"
    blue:
      color: "#3b82f6"
    orange:
      color: "#f9b356"

  # Specify a number of rules - selector/declaration pairs. Each pair will generate a CSS block.
  rules:
    # Style the HTML/SVG with the appropriate status color
    - selectors: |
        #{{monitor.id}},
        [data-monitor-id="{{monitor.id}}"] > *
      declarations: |
        background-color: {{monitor.status.css.metadata.color}} !important;
        fill: {{monitor.status.css.metadata.color}} !important;
    # Add some text for the status/return value of the script
    - selectors: |
        #{{monitor.id}} td:nth-child(2)::after
      declarations: |
        content: "status={{monitor.status.status}} retval={{monitor.status.code}}"
CSS Interpolation
Interpolation is used in the css block to control the display. The interpolation library under the hood is handlebars-rust and any of the advanced syntaxes may be used.
Generally a monitor's output is interpolated from its status JSON, which will have a following form like the given example below:
{
  "id": "my-id",
  "config": {
    "interval": "1m",
    "timeout": "30s",
    "command": "/full/path/to/test.sh"
  },
  "status": {
    "status": "green",
    "code": 0,
    "description": "Success",
    "css": {
      "metadata": {
        "color": "#d0e6a5"
      }
    },
    "metadata": {
      "key": "value1"
    }
  }
}
The root object is named monitor, and you may choose to use any of the keys as such:
{{monitor.id}} = my-id
{{monitor.status.status}} = green
{{monitor.status.css.metadata.color}} = #d0e6a5
{{monitor.status.metadata.key}} = value1
You may use additional text content around the interpolation blocks. For example, background-color: {{monitor.status.css.metadata.color}} !important; will interpolate to background-color: #d0e6a5 !important.
Monitor Configuration
Monitor configurations define how Stylus tests your infrastructure components. Each monitor consists of a test script that runs on a schedule and reports the status back to Stylus.
Monitor Types
Stylus supports several types of monitors:
- Standard Monitor - Single test for a single host
- Group Monitor - Single script that updates multiple monitors
- SNMP Monitor - Network device monitoring via SNMP
- Ping Monitor - Network connectivity monitoring via ping
Logging
Output from the test's standard output and standard error streams are captured and available from the logging endpoint.
Monitor States
The state of a monitor is determined by the return value of the test script or manually set by scripts/expressions. The six states, in order of precedence, are:
| State | Description | How it's set | |
|---|---|---|---|
| Red | 🔴 | Tests that fail by returning a value other than zero | Automatic (exit code ≠ 0) |
| Orange | 🟠 | Warning state | Manual (scripts/expressions) |
| Yellow | 🟡 | A test that has timed out | Automatic (timeout) |
| Blue | 🔵 | Highlight state | Manual (scripts/expressions) |
| Green | 🟢 | Tests that return zero (success) | Automatic (exit code = 0) |
| Blank | ⚪ | A test that has not run or completed yet | Automatic (initial state) |
Metadata
Tests scripts may also set metadata associated with the run. More information on this is available in Advanced Configuration.
Testing Your Configurations
Since monitor scripts with metadata can be tricky to get right, Stylus includes a stylus test command that lets you develop your test script interactively. The output shows your script's stdout and stderr, plus the parsed monitor state as JSON, and the final rendered CSS.
Standard Monitor
A standard monitor consists of a single test for a single host. This is the most common type of monitor in Stylus.
Configuration
test:
  # (optional) The internal ID to use for this test. If omitted, the ID is inferred from the monitor directory's name.
  id: foo
  # How often the test is run. The interval restarts from the last success or failure of the test.
  interval: 60s
  # How long the script will be given to run before it is killed.
  timeout: 30s
  # The test command to run, relative to the monitor directory. The PATH is not used and the file must be
  # directly executable.
  command: test.sh
Example
Here's a simple example of a standard monitor that pings a host:
test:
  id: web-server-ping
  interval: 30s
  timeout: 10s
  command: ping.sh
With a corresponding ping.sh script:
#!/bin/bash
ping -c 1 -W 5 example.com > /dev/null 2>&1
exit $?
Environment Variables
Stylus invokes all test scripts with a special environment variable named STYLUS_MONITOR_ID. This may be used
as a convenient way to test multiple monitors using shared scripts. For example, a test script may be configured
like so:
ssh $STYLUS_MONITOR_ID my-test-command
Group Monitor
A group monitor allows a single test script's execution to update the state for multiple entities. For example, you may be able to scrape the state of multiple hosts from a single controller, or you may want to monitor the state of multiple ports on a single switch.
Configuration
group:
    # The ID pattern for this group. This ID must use interpolation from axis values to generate a set of
    # globally unique IDs.
    id: port-{{ index }}

    # The configuration axes.
    axes:
        # The Axis name and a list of values
        - name: index
          values: [0, 1, 2, 3, 4, 5, 6, 7]

    # A standard monitor configuration (see the Standard Monitor description)
    test:
        interval: 60s
        timeout: 30s
        command: test.sh
State Output
The group's test script is unique in that it must output state-modifying commands to its standard output. Each
of these state-modifying commands starts with the prefix @@STYLUS@@.
echo '@@STYLUS@@ group.port-0.status.status="yellow"'
echo '@@STYLUS@@ group.port-1.status.status="green"'
echo '@@STYLUS@@ group.port-2.status.status="yellow"'
echo '@@STYLUS@@ group.port-3.status.status="green"'
echo '@@STYLUS@@ group.port-4.status.status="green"'
echo '@@STYLUS@@ group.port-5.status.status="yellow"'
echo '@@STYLUS@@ group.port-6.status.status="yellow"'
echo '@@STYLUS@@ group.port-7.status.status="red"'
Example
Here's a complete example of a group monitor that checks the status of multiple network ports:
group:
    id: port-{{ index }}
    axes:
        - name: index
          values: [0, 1, 2, 3, 4, 5, 6, 7, 8, 9, 10, 11, 12, 13, 14, 15, 16, 17, 18, 19, 20, 21, 22, 23]
    test:
        interval: 10s
        timeout: 30s
        command: test.sh
With a corresponding test.sh script:
#!/bin/bash
set -xeuf -o pipefail
echo '@@STYLUS@@ group.port-0.status.status="yellow"'
echo '@@STYLUS@@ group.port-1.status.status="green"'
echo '@@STYLUS@@ group.port-2.status.status="yellow"'
echo '@@STYLUS@@ group.port-3.status.status="green"'
echo '@@STYLUS@@ group.port-4.status.status="green"'
echo '@@STYLUS@@ group.port-5.status.status="yellow"'
echo '@@STYLUS@@ group.port-6.status.status="yellow"'
if [ $((RANDOM % 2)) -eq 0 ]; then
    echo '@@STYLUS@@ group.port-7.status.status="red"'
else
    echo '@@STYLUS@@ group.port-7.status.status="green"'
fi
Metadata
Group monitors can also set metadata for each individual monitor using the same @@STYLUS@@ prefix:
echo '@@STYLUS@@ group.port-0.status.description="Port 0 is experiencing high latency"'
echo '@@STYLUS@@ group.port-0.status.metadata.latency="150ms"'
echo '@@STYLUS@@ group.port-1.status.description="Port 1 is healthy"'
echo '@@STYLUS@@ group.port-1.status.metadata.latency="5ms"'
SNMP Monitor
If you want to monitor network devices, you can often use SNMP to extract information from the device. SNMP allows you to query the device for information about its status using OIDs (Object Identifiers), which are roughly standardized across different devices.
This is particularly useful for monitoring switches, routers, and other network infrastructure.
See the manual for your networking device for the appropriate OIDs to use, or reference one of the following resources:
- https://ldapwiki.com/wiki/Wiki.jsp?page=SNMP
- https://networklessons.com/cisco/ccie-routing-switching/introduction-to-snmp
The SNMP monitor works like a group monitor, but it uses SNMP to query the network device and create children for each detected interface.
Requirements
The SNMP monitor requires the snmpwalk or snmpbulkwalk command to be
installed on the system. These are typically available in the net-snmp
package.
Configuration
Interfaces are first filtered by the include and exclude conditions. If
include is true and exclude is false, the interface is included in the
monitor.
The red, orange, yellow, blue and green conditions are evaluated using
the expressions language. The first condition that is true
will determine the status of the interface.
By default, the SNMP monitor will show interfaces as green if they have
ifOperStatus and ifAdminStatus set to "up", and blank if either of those
is not "up".
snmp:
  # The ID pattern for this monitor. Uses interpolation from interface index.
  id: router-{{ index }}

  # How often the SNMP queries are performed
  interval: 60s

  # How long to wait for SNMP responses
  timeout: 30s

  # (optional) Filter to include certain interfaces (default: "true")
  include: |
    ifType == 'ethernetCsmacd'

  # (optional) Filter to exclude certain interfaces (default: "false")
  exclude: |
    contains(ifDescr, 'Loopback')

  # (optional) Condition that determines when the monitor should be red/error (default: "false")
  red: |
    ifOperStatus == "up" and ifSpeed < 1000000000

  # (optional) Condition that determines when the monitor should be orange/warning (default: "false")
  orange: |
    ifOperStatus == "up" and ifSpeed < 1000000000

  # (optional) Condition that determines when the monitor should be yellow/timeout (default: "false")
  yellow: |
    false

  # (optional) Condition that determines when the monitor should be blue/highlight (default: "false")
  blue: |
    ifOperStatus == "up" and ifSpeed > 1000000000

  # (optional) Condition that determines when the monitor should be green (default: "ifOperStatus == 'up' and ifAdminStatus == 'up'")
  green: |
    ifOperStatus == "up" and ifAdminStatus == "up"

  # SNMP target configuration
  target:
    host: 192.168.1.254
    port: 161 # optional, defaults to 161
    version: 2 # optional, defaults to 2 (1, 2, or 3)
    community: public # for SNMP v1/v2c
    # For SNMP v3:
    # username: myuser
    # auth_protocol: SHA  # optional
    # auth_password: myauthpass  # optional
    # privacy_protocol: AES  # optional
    # privacy_password: myprivpass  # optional
    bulk: true # optional, defaults to true
Parameters
Required Parameters
| Parameter | Description |
|---|---|
id | The monitor ID pattern using interpolation with {{ index }} |
interval | How often to perform SNMP queries |
timeout | SNMP query timeout |
target.host | The IP address or hostname of the SNMP device |
Optional Parameters
| Parameter | Description | Default |
|---|---|---|
include | A filter expression to include certain SNMP interfaces | "true" |
exclude | A filter expression to exclude certain SNMP interfaces | "false" |
red | A condition that determines when the monitor should show red status | "false" |
green | A condition that determines when the monitor should show green status | "ifOperStatus == 'up' and ifAdminStatus == 'up'" |
target.port | SNMP port | 161 |
target.version | SNMP version (1, 2, or 3) | 2 |
target.community | SNMP community string (for v1/v2c) | "public" |
target.username | SNMP username (for v3) | - |
target.auth_protocol | Authentication protocol (SHA, MD5, etc.) | - |
target.auth_password | Authentication password | - |
target.privacy_protocol | Privacy protocol (AES, DES, etc.) | - |
target.privacy_password | Privacy password | - |
target.bulk | Use bulk SNMP operations | true |
Example
Here's a complete example of an SNMP monitor for a network switch:
snmp:
  id: switch-{{ index }}
  interval: 60s
  timeout: 30s
  exclude: |
    ifType != 'ethernetCsmacd'
  red: |
    ifOperStatus == "up" and ifSpeed < 1000000000
  target:
    host: 192.168.1.254
    community: public
This monitor will:
- Query the switch at 192.168.1.254 every 60 seconds
- Only monitor Ethernet interfaces (exclude other interface types)
- Show red status if an interface is up but running at less than 1Gbps
- Use the "public" community string for SNMP authentication
SNMP OIDs
The SNMP monitor automatically queries the SMTP ifTable table, and makes the
OIDs available in expressions. The most useful ones you might want to use are:
| Field | OID/Variable | Description |
|---|---|---|
| Status | ifOperStatus | Operational status of interface (up or down, ie: copper connected, fiber connected, etc.) |
| Admin Status | ifAdminStatus | Administrative status of interface (up or down, ie: enabled or disabled by the administrator) |
| Type | ifType | Type of interface (ethernetCsmacd, loopback, other, etc.) |
| Speed | ifSpeed | Speed of interface |
| Description | ifDescr | Description of interface |
| Name | ifName | Name of interface |
| Alias | ifAlias | Alias of interface |
| MTU | ifMtu | Maximum Transmission Unit |
| Physical Address | ifPhysAddress | Physical (MAC) address |
You can see the OIDs available in the ifTable table on your specific device
with the snmptable command:
# Print the headers of the ifTable table
snmptable -Ch -v 2c -c public 192.168.1.1 ifTable | head -1
SNMP Versions
The SNMP monitor supports SNMP v1, v2c, and v3. The default is to use v2c with
the public community string. Bulk operations are enabled by default, but can
be disabled for older devices.
SNMP v1/v2c
snmp:
  # ... other configuration ...
  target:
    host: 192.168.1.254
    version: 2 # or 1
    community: public
SNMP v3
snmp:
  # ... other configuration ...
  target:
    host: 192.168.1.254
    version: 3
    username: myuser
    auth_protocol: SHA
    auth_password: myauthpass
    privacy_protocol: AES
    privacy_password: myprivpass
Ping Monitor
The ping monitor uses the system ping command to check network connectivity to
a host. It measures round-trip time and packet loss, making it useful for
monitoring network latency and availability.
Configuration
The ping monitor evaluates conditions using the expressions language.
By default, the ping monitor will show:
- Green if there's no packet loss and the round-trip time is within the warning timeout
- Orange if there's no packet loss but the round-trip time exceeds the warning timeout, or if there was partial packet loss
- Yellow if the ping command timed out
- Red if there was complete packet loss
ping:
  # The host to ping (IP address or hostname)
  host: 8.8.8.8

  # How often to perform the ping test
  interval: 60s

  # How long to wait for ping responses before timing out
  timeout: 5s

  # (optional) Warning threshold for round-trip time (default: 1s)
  warning_timeout: 1s

  # (optional) Number of ping packets to send (default: 1)
  count: 1

  # (optional) Condition that determines when the monitor should be red/error (default: "lost == count")
  red: |
    lost == count

  # (optional) Condition that determines when the monitor should be orange/warning (default: "lost > 0 or (lost == 0 and rtt_max > warning_timeout)")
  orange: |
    lost > 0 or (lost == 0 and rtt_max > warning_timeout)

  # (optional) Condition that determines when the monitor should be green (default: "lost == 0")
  green: |
    lost == 0

  # (optional) Condition that determines when the monitor should be blue/highlight (default: "false")
  blue: |
    false

  # (optional) Condition that determines when the monitor should be yellow/timeout (default: "false")
  yellow: |
    false
Parameters
Required Parameters
| Parameter | Description |
|---|---|
host | The IP address or hostname to ping |
interval | How often to perform ping tests |
timeout | How long to wait for ping responses |
Optional Parameters
| Parameter | Description | Default |
|---|---|---|
warning_timeout | Round-trip time threshold for orange status | 1s |
count | Number of ping packets to send | 1 |
red | Condition for red status | "lost == count" |
orange | Condition for orange status | "lost > 0 or (lost == 0 and rtt_max > warning_timeout)" |
green | Condition for green status | "lost == 0" |
blue | Condition for blue status | "false" |
yellow | Condition for yellow status | "false" |
Expression variables
| Variable | Description |
|---|---|
count | Number of ping packets sent |
lost | Number of packets lost |
rtt_avg | Average round-trip time in microseconds |
rtt_min | Minimum round-trip time in microseconds |
rtt_max | Maximum round-trip time in microseconds |
warning_timeout | The configured warning timeout value in microseconds |
Example
Ping Google's DNS server using the default settings:
ping:
  host: 8.8.8.8
Ping Google's DNS server with custom settings:
ping:
  host: 8.8.8.8
  interval: 30s
  timeout: 10s
  warning_timeout: 500ms
  count: 3
  red: |
    lost > 0
  orange: |
    lost == 0 and rtt_min > warning_timeout
This monitor will:
- Ping Google's DNS server (8.8.8.8) every 30 seconds with three packets
- Wait up to 10 seconds for responses
- Show orange/warning status if the shortest round-trip time exceeds 500ms (ie: all pings were slow)
- Show red/error status if any packets are lost
Requirements
The ping monitor requires the ping command to be available on the system. This
is typically installed by default on most Unix-like systems.
Expression Language
Stylus uses a custom expression language for evaluating conditions in monitor configurations. This language supports arithmetic operations, logical operations, string manipulation, and comparisons.
Overview
The expression language is currently only used in the SNMP and ping monitors.
Data Types
The expression language supports two main data types:
- Integers: Whole numbers (e.g.,
42,-17,0) - Strings: Text values enclosed in quotes (e.g.,
"hello",'world')
Literals
Numbers
42        // Positive integer
-17       // Negative integer
0         // Zero
Strings
Strings can be enclosed in single or double quotes:
"hello world"    // Double quotes
'hello world'    // Single quotes
Escape Sequences
Strings support escape sequences:
"hello \"world\""    // Escaped double quote
'hello \'world\''    // Escaped single quote
"hello \\world\\"    // Escaped backslash
Boolean Values
true      // Boolean true (evaluates to 1)
false     // Boolean false (evaluates to 0)
Arithmetic Operations
Basic Arithmetic
a + b     // Addition (numbers) or concatenation (strings)
a - b     // Subtraction
a * b     // Multiplication
a / b     // Division
a ^ b     // Exponentiation (a raised to power b)
-a        // Negation
Examples
2 + 3           // 5
"hello" + " " + "world"    // "hello world"
10 - 3          // 7
4 * 5           // 20
15 / 3          // 5
2 ^ 3           // 8
-5              // -5
Comparison Operations
Comparison Operators
a == b    // Equal to
a != b    // Not equal to
a > b     // Greater than
a < b     // Less than
a >= b    // Greater than or equal to
a <= b    // Less than or equal to
Examples
5 == 5           // true
"up" == "down"   // false
10 > 5           // true
"abc" < "def"    // true
7 >= 7           // true
3 <= 10          // true
Logical Operations
Logical Operators
a and b   // Logical AND
a or b    // Logical OR
not a     // Logical NOT
Examples
true and true    // true
true and false   // false
true or false    // true
false or false   // false
not true         // false
not false        // true
String Functions
String Manipulation
startswith(str, prefix)    // Check if string starts with prefix
endswith(str, suffix)      // Check if string ends with suffix
contains(str, substr)      // Check if string contains substring
length(str)                // Get string length
Examples
startswith("hello world", "hello")    // true
endswith("hello world", "world")      // true
contains("hello world", "lo wo")      // true
length("hello")                       // 5
Type Conversion Functions
Type Conversion
str(value)    // Convert value to string
int(value)    // Convert value to integer
Examples
str(42)       // "42"
int("123")    // 123
str(true)     // "1"
int("abc")    // 0 (default for failed conversion)
Precedence and Associativity
The expression language follows Python-like precedence rules (from lowest to highest):
orandnot- Comparisons (
==,!=,>,<,>=,<=) - Addition/Subtraction (
+,-) - Multiplication/Division (
*,/) - Exponentiation (
^) - Functions, parentheses, literals, variables
Examples
a == 1 and b == 2 or c == 0    // ((a == 1) and (b == 2)) or (c == 0)
not a == 1                      // not (a == 1)
2 + 3 * 4                       // 2 + (3 * 4) = 14
2 ^ 3 + 1                       // (2 ^ 3) + 1 = 9
Truthiness
Values are considered "truthy" or "falsy" in logical operations:
- Falsy values:
0,""(empty string),false - Truthy values: Any non-zero number, any non-empty string,
true
Examples
0 and "hello"      // false (0 is falsy)
1 and "hello"      // true (both are truthy)
"" or 42           // true (42 is truthy)
not 0              // true
not "hello"        // false
Context Variables
Depending on the context, the expression language has access to different local variables.
SNMP Examples
The SNMP monitor makes the OIDs for each interface available as context variables.
// Check if interface is up and admin enabled
ifOperStatus == "up" and ifAdminStatus == "up"

// Check if interface is Ethernet and not loopback
ifType == "ethernetCsmacd" and not contains(ifDescr, "Loopback")

// Check if interface speed is less than 1Gbps
ifSpeed < 1000000000

// Check if interface description contains specific text
contains(ifDescr, "10G Ethernet Adapter")
Advanced Configuration
Metadata
A test script may update metadata for the monitor, including the built-in status and description fields. These commands start with the prefix @@STYLUS@@ and may be output to standard output or standard error.
An example of metadata update commands is shown below:
echo '@@STYLUS@@ status.description="Custom (yellow)"'
echo '@@STYLUS@@ status.status="yellow"'
echo '@@STYLUS@@ status.metadata.key="value1"'
These may be referenced via standard interpolation, such as {{monitor.status.metadata.key}}.
Environment variables
Stylus invokes all test scripts with a special environment variable named STYLUS_MONITOR_ID. This may be used
as a convenient way to test multiple monitors using shared scripts. For example, a test script may be configured
like so:
ssh $STYLUS_MONITOR_ID my-test-command
General Tips
There are several approaches you can take to monitoring with Stylus. This section covers general best practices and tips for writing effective monitor scripts.
STYLUS_MONITOR_ID
The STYLUS_MONITOR_ID environment variable is set by Stylus to the monitor's
ID when running a monitor script. This allows you to write monitor scripts that
can be re-used across multiple monitors.
#!/bin/bash
set -xeuf -o pipefail
# Check the health of a service running on the monitor
curl --fail http://$STYLUS_MONITOR_ID:8080/health | jq --raw-output '.status'
Safe Scripting
Because monitor scripts may have a large number of moving parts, consider using safe shell scripting techniques to ensure that any failure of any kind will return an error code.
In addition set -x can be useful to print all commands that run as part of a
monitor script. These are available in the logging endpoints and will show you
the expansion of environment variables.
#!/bin/bash
set -xeuf -o pipefail
Script-relative Paths
The dirname command can be used to get the directory of the script that is
running. This can be useful to locate configuration files or other resources
that are needed by the script, which allows you to run the script from any
directory outside of Stylus.
#!/bin/bash
set -xeuf -o pipefail
DIR="$( cd "$( dirname "${BASH_SOURCE[0]}" )" >/dev/null 2>&1 && pwd )"

CONFIG_FILE=$DIR/config.yaml
Testing Your Configurations
As monitor scripts using metadata can be somewhat tricky to get right,
Stylus includes a test command-line
argument to allow you to develop your test
script in a slightly more interactive manner.
The output from stylus test will include the test script's stdout and stderr
streams, as well as the parsed monitor state as JSON, and the final rendered
CSS.
Examples
See some example configurations and use cases for Stylus.
Monitors
Writing complex monitors can be challenging. Here are some examples of how to monitor various services and devices:
- ping: Basic connectivity monitoring using ping
- Web/HTML/API Scraping: Monitoring web services and APIs
- SNMP: Monitoring network devices with SNMP
- SSH: Remote monitoring over SSH
Projects
The github repository contains a number of example projects that you can use as a starting point for your own configuration.
- Minimal: Basic configuration example
- Metadata: Adding custom metadata to monitors
- Simple Network: A basic network monitoring example
- Group: Using group monitors to monitor multiple services with a single script
- Dynamic: Using React for dynamic updates
- D3.js: Using D3.js to create interactive diagrams
- IsoFlow: Using IsoFlow to create isometric diagrams
Ping Monitoring
The simplest monitor is a ping script. One ping is usually enough for most cases. You can pass a timeout to ping, but Stylus will automatically kill processes if they run too long.
Built-in Ping Monitor
Stylus has a built-in ping monitor that can be used to monitor network connectivity.
ping:
  host: 8.8.8.8
  interval: 30s
  timeout: 10s
  count: 1
Custom Ping Script
You can also write a custom ping script to test the connectivity to a host.
test:
  id: my-ping-host
  interval: 30s
  timeout: 10s
  command: ping.sh
With a corresponding ping.sh script:
#!/bin/bash
# Pings the host with the same name as the monitor's ID
ping -c 1 ${STYLUS_MONITOR_ID}
Pinging a custom host:
#!/bin/bash
ping -c 1 8.8.8.8
Pinging with a custom per-packet timeout:
#!/bin/bash
# -W is in seconds on Linux
ping -c 1 -W 5 ${STYLUS_MONITOR_ID}
Alternatives
For more complex monitoring scenarios, consider using SSH, SNMP, or HTML/API scraping.
SSH Monitoring
SSH monitoring allows you to execute commands on remote systems and check their status. This is useful for monitoring servers, network devices, and other systems that support SSH access.
SSH Configuration
To make your life easier, you can collect all of your SSH credentials in a configuration file. The examples in this section will assume you've got a central SSH configuration file.
host pi-*
	User matt
host tower
	User root
host unifi-*
	User admin
host *
	IdentityFile /srv/ssh_id_rsa
Security Considerations
Depending on your security requirements, you may wish to loosen some of your SSH client's security check requirements. By disabling strict host key checking and host IP checking, your monitors will be more reliable but there will be some tradeoffs.
ssh <...> -oStrictHostKeyChecking=no -oCheckHostIP=no
Basic SSH Check
# Assumes that `ssh_config` lives in the same folder as this script
DIR="$( cd "$( dirname "${BASH_SOURCE[0]}" )" >/dev/null 2>&1 && pwd )"
SSH_CONFIG=$DIR/ssh_config

ssh_check () {
    local host="$STYLUS_MONITOR_ID"
    ssh -F $SSH_CONFIG $host -oStrictHostKeyChecking=no -oCheckHostIP=no "true"
}

ssh_check
SSH + Gather Basic Hardware Info
# Assumes that `ssh_config` lives in the same folder as this script
DIR="$( cd "$( dirname "${BASH_SOURCE[0]}" )" >/dev/null 2>&1 && pwd )"
SSH_CONFIG=$DIR/ssh_config

ssh_check () {
    local host="$STYLUS_MONITOR_ID"
    ssh -F $SSH_CONFIG $host -oStrictHostKeyChecking=no -oCheckHostIP=no \
        "uname -a && uptime && cat /proc/cpuinfo | grep -i -E '(hardware|model|stepping|revision)' | sort | uniq"
}

ssh_check
Alternatives
For simpler connectivity tests, consider ping monitoring. For network devices, consider SNMP monitoring.
SNMP Monitoring
SNMP (Simple Network Management Protocol) is a useful way to write more complex checks for network devices, but the output of the tools requires some massaging.
Stylus has a built-in SNMP monitor that can be used to monitor network devices, but in some cases you may want to write a custom script to monitor SNMP devices for more complex checks.
Basic SNMP Check
This performs a simple SNMP "ping" to the device, asking for its sysDescr and
sysUpTime OIDs (system description and uptime respectively).
#!/bin/sh
set -xeuf -o pipefail
# Print the SNMP OID for the system description
snmpwalk -v 2c -c public my-network-router 1.3.6.1.2.1.1.1.0
# Print the SNMP OID for the system uptime
snmpwalk -v 2c -c public my-network-router 1.3.6.1.2.1.1.3.0
SNMP Group Monitor
You can use a group monitor to monitor multiple devices at once using SNMP.
snmp_check () {
    local host="$STYLUS_MONITOR_ID"
    ARR=`snmpbulkwalk -OsQ -c public $host ifTable`
    jq -n --arg inarr "${ARR}" '[$inarr | split("\n")
        | .[]
        | capture("(?<key>[^\\.]+)\\.(?<idx>\\d+)\\s+=\\s+(?<value>.*)")
    ] | group_by(.idx) | .[] | from_entries'
}

# Some legacy devices only respond to SNMP v1
snmp_v1_check () {
    local host="$STYLUS_MONITOR_ID"
    ARR=`snmpwalk -v1 -OsQ -c public $host ifTable`
    jq -n --arg inarr "${ARR}" '[$inarr | split("\n")
        | .[]
        | capture("(?<key>[^\\.]+)\\.(?<idx>\\d+)\\s+=\\s+(?<value>.*)")
    ] | group_by(.idx) | .[] | from_entries'
}

snmp_parse () {
    cat - | jq -r '
        # Only parse ethernet ports and omit anything that looks like a vlan port (ending with a .xxxx)
        select(.ifType=="ethernetCsmacd" and (.ifDescr | test("\\.\\d+$") | not))
        | "@@STYLUS@@ group.'$STYLUS_MONITOR_ID'-"
            + .ifIndex
            + ".status.status="
            + (if .ifOperStatus == "up" then "\"green\"" else "\"blank\"" end)'
}

# Map the SNMP JSON output to @@STYLUS@@ metadata updates
snmp_check | snmp_parse
Alternatives
For simpler connectivity tests, consider ping monitoring. For server monitoring, consider SSH monitoring.
Web/HTML/API Scraping
Some devices can be tested using a simple cURL script, while others require more complex HTML parsing and API interaction.
Simple cURL Check
curl --silent --max-time 2 <url>
HTML Scraping with pup and jq
In other cases you may want to scrape HTML. The pup tool is included in the docker image to make this easier. You can use the json{} filter to pass a pre-processed HTML DOM tree to jq for further processing.
This example scrapes the power state from a Web Power Switch 7:
#!/bin/bash
set -euf -o pipefail

function fetch() {
    curl --silent --max-time 2 --basic -u <credentials> <url> \
        | pup -c "table table tr[bgcolor=#F4F4F4] json{}" \
        | jq "[.[] | [.children | .. | .text? | select(. != null)] | { \"name\": .[1], \"state\": (.[2]==\"ON\") }]"
}

n=0
until [ "$n" -ge 10 ]
do
   HTML=`fetch` && break
   n=$((n+1))
done

echo $HTML | \
    jq -r -e ". | to_entries | .[] | \"@@STYLUS@@ group.power-\" + (.key + 1 | tostring) + \".status.status=\" + if .value.state then \"\\\"green\\\"\" else \"\\\"blank\\\"\" end"
Alternatives
For simpler connectivity tests, consider ping monitoring. For server monitoring, consider SSH monitoring.
Creating SVG Diagrams
Short story: Using a tool like diagrams.net, create an SVG diagram of your network. Attach an SVG DOM attribute to the elements you'd like to style with status changes. If you're using diagrams.net, this can be done using the svgdata plugin. Alternatively, you can use the automatic identifiers generated by your SVG editor as your monitoring identifiers.
From the SVG you've generated, create CSS selectors and rules that will apply
styles to the appropriate elements as statuses change. The SVG fill attribute
is a good candidate to change, but ensure that you're using !important on all
your rules to override the fill colors created by your SVG editor.
Detailed guide
Enable one of the networking diagram sets on diagrams.net that matches the style of diagram you'd like to create.

For each of the networking elements you've dropped on the canvas, click the "edit data" button to add metadata.

Set a custom property named infra-id. This will be the ID we'll later use to configure the diagram.

Once you've completed your diagram, export it as an SVG.

These are the recommended options you can use to create a standalone SVG file.

The final result.

And the final SVG source:
<?xml version="1.0" encoding="UTF-8"?>
<!DOCTYPE svg PUBLIC "-//W3C//DTD SVG 1.1//EN" "http://www.w3.org/Graphics/SVG/1.1/DTD/svg11.dtd">
<svg xmlns="http://www.w3.org/2000/svg" style="background-color: rgb(255, 255, 255);" xmlns:xlink="http://www.w3.org/1999/xlink" version="1.1" width="181" height="167" viewBox="-0.5 -0.5 181 167">
<defs>
<filter id="dropShadow">
<feGaussianBlur in="SourceAlpha" stdDeviation="1.7" result="blur"/>
<feOffset in="blur" dx="3" dy="3" result="offsetBlur"/>
<feFlood flood-color="#3D4574" flood-opacity="0.4" result="offsetColor"/>
<feComposite in="offsetColor" in2="offsetBlur" operator="in" result="offsetBlur"/>
<feBlend in="SourceGraphic" in2="offsetBlur"/>
</filter>
</defs>
<g filter="url(#dropShadow)">
<g id="cell-f1RpjmRWZniSFc_S4n2y-1" content="<object label="" infra-id="firewall"/>" data-label="" data-infra-id="firewall">
<rect x="0" y="20" width="50" height="44" fill="none" stroke="none" pointer-events="all"/><path d="M 0 64 L 0 54.01 L 23.64 54.01 L 23.64 64 Z M 25 54.01 L 50 54.01 L 50 64 L 25 64 Z M 37.5 52.75 L 37.5 42.71 L 50 42.71 L 50 52.75 Z M 36.04 42.71 L 36.04 52.75 L 13.91 52.75 L 13.91 42.71 Z M 12.55 52.75 L 0 52.75 L 0 42.66 L 12.55 42.66 Z M 23.59 41.44 L 0 41.44 L 0 31.4 L 23.59 31.4 Z M 25 31.4 L 50 31.4 L 50 41.44 L 25.1 41.44 Z M 37.5 30.09 L 37.5 20 L 50 20 L 50 30.09 Z M 36.04 20.05 L 36.04 30.09 L 13.91 30.09 L 13.91 20.05 Z M 12.45 30.09 L 0 30.09 L 0 20.05 L 12.45 20.05 Z" fill="#00188d" stroke="none" pointer-events="all"/></g><g id="cell-f1RpjmRWZniSFc_S4n2y-3" content="<object label="" infra-id="server-a"/>" data-label="" data-infra-id="server-a"><rect x="140" y="0" width="24" height="50" fill="none" stroke="none" pointer-events="all"/>
<path d="M 140 50 L 140 2.51 C 140 1.12 141.11 0 142.47 0 L 161.53 0 C 162.89 0 164 1.12 164 2.51 L 164 50 Z M 143.6 45.08 L 160.4 45.08 L 160.4 42.67 L 143.6 42.67 Z M 160.4 40.26 L 160.4 37.8 L 143.6 37.8 L 143.6 40.26 Z M 143.6 9.79 L 160.4 9.79 L 160.4 7.33 L 143.6 7.33 Z" fill="#00188d" stroke="none" pointer-events="all"/>
</g>
<g id="cell-f1RpjmRWZniSFc_S4n2y-4" content="<object label="" infra-id="server-c"/>" data-label="" data-infra-id="server-c">
<rect x="90" y="110" width="24" height="50" fill="none" stroke="none" pointer-events="all"/>
<path d="M 90 160 L 90 112.51 C 90 111.12 91.11 110 92.47 110 L 111.53 110 C 112.89 110 114 111.12 114 112.51 L 114 160 Z M 93.6 155.08 L 110.4 155.08 L 110.4 152.67 L 93.6 152.67 Z M 110.4 150.26 L 110.4 147.8 L 93.6 147.8 L 93.6 150.26 Z M 93.6 119.79 L 110.4 119.79 L 110.4 117.33 L 93.6 117.33 Z" fill="#00188d" stroke="none" pointer-events="all"/>
</g>
<g id="cell-f1RpjmRWZniSFc_S4n2y-5" content="<object label="" infra-id="server-b"/>" data-label="" data-infra-id="server-b">
<rect x="150" y="80" width="24" height="50" fill="none" stroke="none" pointer-events="all"/>
<path d="M 150 130 L 150 82.51 C 150 81.12 151.11 80 152.47 80 L 171.53 80 C 172.89 80 174 81.12 174 82.51 L 174 130 Z M 153.6 125.08 L 170.4 125.08 L 170.4 122.67 L 153.6 122.67 Z M 170.4 120.26 L 170.4 117.8 L 153.6 117.8 L 153.6 120.26 Z M 153.6 89.79 L 170.4 89.79 L 170.4 87.33 L 153.6 87.33 Z" fill="#00188d" stroke="none" pointer-events="all"/>
</g>
</g>
</svg>